The following is a brief introduction to two novel forms of computer graphics perimetry from Göteborg, Sweden. The main aims are to illuminate the rationales behind these new types of tests and to convey a feeling for what the results look like. Links and references to more detailed information will be provided in the text.
Is there really a need for new perimeters?
Note: the following section deals with some fairly complicated physiological and pathophysiological aspects of perimetry. For descriptions of the actual tests, go to the next section.
The classical differential light sense (DLS) measurements, that is, estimates of simple, achromatic contrast thresholds, have been around since the late 1800's and they remain by far the dominating form of measurement. It is certainly legitimate to ask whether there is a need for new types of measurements. It is equally legitimate to ask what DLS really measures, that is, what is the relationship between measuring values and the state of the neural visual system. Unfortunately, there is no simple answer. Similarly, there is no simple answer why DLS requires losses of some 25 - 50% of neural channels before returning abnormal results. The reason why DLS has remained so popular is not its firm theoretical underpinnings but the ease of technical realization. Projecting a spot of light is very much easier than arranging for stimulation with more complex targets like optotype letters or sinusoidal gratings. Such resolution-type targets have an intuitive coupling to the spatial density of neural elements in the retina, specifically the retinal receptive fields. This idea has an even longer history than DLS, going back to Aubert and Förster, who presented one of the very first perimeters in 1857, and the great physiologist, Herman von Helmholtz (1867). Incidentally, readers with an interest in the history of perimetry may enjoy the introduction presented by the
International Perimetric Society.
Numerous studies have been made over the years of resolution capacity across the visual field in normal subjects, using a variety of resolution-type test targets. Unfortunately, most resolution targets are impracticable in clinical visual
field testing because they typically have two disparate
thresholds, namely, one for detection and one for resolution.
This is easily recognized in daily life, for example, on approaching a distant road sign. The presence of letters can be recognized at a much longer viewing distance than that required for resolving the letters. The application of so-called high-pass spatial frequency filtering brings the target's detection and resolution thresholds into coincidence (Howland, Ginsburg & Campbell 1978 [
1])
and makes for a very simple test task, also in peripheral vision. High-pass resolution targets are easily generated in computer graphics. The scene was now set for High-pass Resolution or "Ring" Perimetry, HRP, which was presented in 1987. Its theoretical underpinnings were recently confirmed in a clinico-pathological study (Sjöstrand & Popovic 2005 [
2]).
The modus operandi of HRP is to find the smallest discernible test target in a given location in the visual field. This is a straightforward procedure, as shown in the
interactive demonstration.
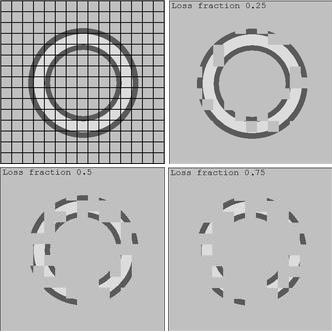
But, what if a test target straddles a deep scotoma, so that only a part of the target is visible? Should the patient respond in this situation? Actually, the question may seem artificial, because patients very rarely indicate that they see only parts of test targets (presumably because of the operation of cerebral "filling-in" mechanisms). Nevertheless, the question is disturbing. This is because it points to a possible excess of information in the target. How much of a target can be taken away without raising the threshold level? A simple answer is "most". The figure to the right illustrates various levels of degradation of an HRP target. Degradation was done by erasing blocks of a fixed size in random locations. The figure begs the question at what level of degradation crucial features have been lost. A similar neural degradation should occur when a target is imaged on a defective neural matrix. Degradation may still be imperceptible because of cerebral filling-in. Note that the possibility of over-abundant stimulation is common to all conventional perimetric test targets.
The above figure illuminates another difficulty encountered when attempting to associate test results with neural parameters, namely, the lack of a simple metric for partially depleted neural matrices. Consider for a moment a normal patch of retina with a linear receptive field packing density of, say, 100 units per millimeter. Now, imagine that one-half of the receptive fields are lost, in a random distribution. What is the resulting packing density? The simple answer, 50 units/mm, is correct in a simplistic numerical sense, but those neural units that have escaped damage have not changed their original locations. Hence, there may be some sub-patches that retain a normal density, some that have no receptive fields at all, and some that have receptive field densities in-between these extremes. Any normal sub-patches may suffice to uphold normal test results. Is there a way to assess damage under such conditions?
The proposed solution to the problems of over-abundant stimulation and irregular spatial wasting of neural channels is RareBit Perimetry. Using minuscule test targets, RareBit Perimetry repeatedly probes ever-new locations within circumscribed visual field areas for the presence of function. Because receptive fields normally tile the retina completely, without gaps or overlaps, the expected response is all probes seen. Eyes that have lost a portion of their neural units are expected to miss some probes, in proportion to the degree of damage. RareBit Perimetry was presented in 2002.
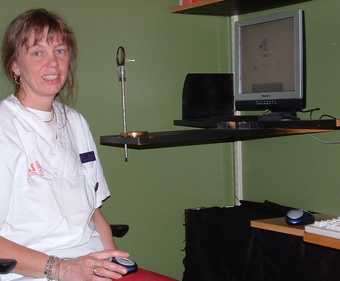
HRP or "ring" perimetry utilizes dual monitors driven by a personal computer (PC), arranged for maximum physical comfort for both the patient and the examiner. The ring perimeter was the first to dispense with an uncomfortable headrest, the first to include several feedback features, and the first to adapt to current reaction times. The latter features help to make the patient feel in command of the procedure. The use of an ordinary PC makes it possible not only to serve mundane PC tasks but also to address a host of non-perimetric diagnostic tasks, for example, testing optokinetic nystagmus and simulating migraine auras. Hence, HRP is part of a versatile diagnostic system, named the Ophthimus System. It was introduced in 1987 and was distributed by
Visumetrics/HighTech Vision.
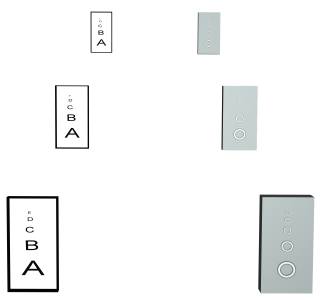
Each HRP test target consists of a bright circular core surrounded by dark borders. The dimensions and luminances are carefully calculated to make the target invisibly melt into the background if unresolved (try viewing the below figure from various distances to see the vanishing effect).
The short test distance, 0.16 m, causes powerful foreshortening of peripherally presented targets, and powerful parallax effects in the monitor's glass envelope. These effects are compensated in software, so the rings always appear as true rings of correct angular dimensions. 14 different sizes are used, stepped by 0.1 of a logarithmic unit (1 decibel, dB). The largest ring nearly fills a full quadrant. Limitations of monitor technology precludes measurement of thresholds inside 5° from fixation unless test distance is increased as is done in the
CentRing test.
One very practical advantage of using different-size targets is that the test can begin with a check for the presence of vision in extended areas, even full quadrants. If no response is obtained, that area will not be further tested. This has the perhaps paradoxical effect of returning shorter examination times for severely damaged visual fields. Normal examination time is about 5 minutes. Fixation is monitored by occasionally projecting a target in the blindspot and fixation is encouraged by occasionally flashing a "Look here" text message at the fixation spot. Audible complaints are sounded on errors.
Thresholds are determined by up-down stepping procedures, using different-size steps in different phases of the examination. The different phases are devised to retain a maximum of information if the test is aborted prior to completion. There are two convenient abortion points for patients with limited endurance. One point occurs when thresholds have been obtained for the four quadrant centers (which requires less than 1 minute of testing time), another occurs midway, when one-half of the locations have been tested, after about 2.5 minutes. At this point the test stops for rest.
HRP tests 50 locations inside the 30° central visual field. The locations are distributed in a pattern reminescent of normal isopters. This is calculated to facilitate both visual recognition of common field defect patterns and statistical analysis of results. Results are plotted as threshold target sizes, showing precisely what the patient could see in each location. The unusual format of result presentation initially received some criticism from perimetrists preferring interpolated gray-scales but the native format is retained. Its intuitive nature is appreciated by the patients, not the least in situations were it is necessary for patients to understand any limitations, for example, with regard to driving licenses. Further, intuitive understanding of results is a powerful incitament to good co-operation in follow-up examinations. Michael Wall's Motion Detection Perimetry uses a similar map format.
HRP as described above has undergone two major revisions, motivated by improvements in PC display technology. Version 1 was actually ahead of off-the-shelf technology and required cutting and soldering inside the graphic card. The latest version, No. 3, remains unchanged since 1998 and still works diligently in many places around the world, both in clinics and in research settings (including my own). The illustrated Version 3 manual can be downloaded here.
The dual monitor HRP set-up became increasingly difficult to maintain with the rapidly changing flora of graphics cards and monitors. A single-monitor version (Ring-1) was produced but proved somewhat awkward to use in practice. There was an increasing demand for a change from the original DOS operating system to Microsoft Windows. A Windows transplant would make it possible to keep abreast of hardware developments but appeared too daunting a task for me. Also, the first ideas about RareBit Perimetry were germinating at this time. However, the non-perimetric diagnostic tools mentioned above have been recoded and posted on this site and new tools have been added; a complete list is provided
here.
Conversion of HRP to Windows has been completely taken over by another party. The new Version 4, which incorporates full-fledged data-base and network support, is currently distributed in the Scandinavian countries. It uses one monitor only. Any queries should be addressed to the
distributor.
I am not involved in Version 4.
How does HRP compare with other forms of perimetry? There is no short answer because there are many factors involved in the evaluation of perimetric quality. The only aspect that is easily answered is that of patient satisfaction, where HRP shines. HRP is known to perform well in glaucoma and optic neuropathy contexts. Being a resolution-type test, it is sensitive to cataract. Many other aspects have been analysed in a large number of studies. Click
here to download a list of 200+ presentations.
It has been well documented that some 25 to 50% of neural elements must be lost before conventional perimetry returns abnormal results. It is also well known that conventional perimetry suffers from a troublesome variability. It may be argued that these problems are attributable to the use of test stimuli that are large relative to the receptive units of the visual system (the retinal receptive fields) and the use of threshold measures to characterize performance. It would carry too far to explore the arguments in detail here. Instead, the interested reader is referred to the original presentation
(pdf format, 210 KB). It is argued that sensitivity to minor damage should improve with the use of test stimuli that are small relative to receptive fields and that variability should decrease by avoiding thresholding.
RareBit Perimetry depends on minute stimuli ("rare" bits or "microdots") and it replaces the conventional thresholding approach ("How well do you see here?") with simple checks for the presence of function ("Is there a receptive field here? And here? And here?"). Hence, rather than gauging the level of function, RBP probes the integrity of the neural matrix.
The animation schematically illustrates these ideas. The hexagons represent a small set of retinal receptive fields, of which 10 per
cent (randomly selected) are damaged (black). A DLS test target (white circle) typically envelops numerous
receptive field positions and is expected to return a normal result with this small degree of damage. Rarebits (red dots) are
very much smaller. With multiple presentations in ever-new locations, 10 per cent of the rarebit presentations should involve a damaged receptive
field and so go unseen.
The practical realization of RBP requires several departures from customary techniques. One departure concerns the definition of test patterns.
In conventional perimetry, test patterns are usually defined in terms of numbers of test locations, e g, HFA 30-2. Each location is tested again and again to bracket its threshold. This is not a usable approach on the microdot scale because continuous micro eye movements make it virtually impossible to return to one and the same receptive field for repeated testing. Instead, RBP uses a set number (24) of rectangular test areas and probes repeatedly for the presence of vision within each area, in ever-new locations. Because the retina normally is seamlessly tiled by receptive fields, the expected outcome is that all rarebits should be seen (100% "hit rate", or nearly so: provision has to be made for the blindspot and angioscotomas, and for lapses of attention). Note that the hit rate does not vary with eccentricity in normal eyes. From the RBP point of view, the normal "Hill of Vision" is flat as a pancake. On the other hand,
most disorders of the visual system result in more or less extensive losses or disconnections of receptive fields. Hence, there should appear corresponding "holes" in the receptive field matrix where rarebit presentations would not be seen. The spatial density of holes would be expected to cause a proportionate reduction in hit rates. For example, a 10% loss of receptive fields should, on average, result in a 10% reduction in rarebit hit rate, to 90%, as in the animation above.
RBP is implemented in computer graphics, in a single-monitor set-up. The software runs under Microsoft Windows. The test requires a modern liquid crystal display (LCD) and 0.5 m test distance (1 m for the central-most field). Both the LCD technology and the long test distance are crucial to achieve the required stimulus parameters (dot size = one-half of normal minimum angles of resolution; white dots on a black background). A 15" LCD occupies no more than 30° of visual angle at 0.5 m distance but by moving the fixation mark under software control it is possible to access a 60x45° visual field area. Incidentally, fixation is not monitored. This is not because fixation is unimportant but fixation data is notoriously difficult to evaluate. Instead, fixation is encouraged by dynamically altering the fixation mark.
The simplest implementation would be to present microdots one by one but RBP presents pairs of dots, spaced by 4°, in the interest of saving on test time. Hence, for each presentation, the subject has to indicate whether he or she saw 1 dot, 2 dots, or none at all. This is done by clicking, double-clicking, or not clicking on the computer mouse. The test principle can be tried in an interactive demonstration.
The test provides feedback, both visually and by sound. The test runs over all 24 test locations once. This takes less than a minute. The test then stops for as a long a pause as required in the individual case. It is then repeated. The number of repeats is under the operator's control and govern the precision of measurements. Five passes may be a good compromise between patient tolerance and clinical needs. Results are plotted in a gray-scale format. The more dark rectangles there are, the more widespread the damage; the darker the
rectangles, the more severe the damage. Various simple statistics are provided automatically.
In addition to the regular 30° central-field test, there are functions for testing flanking regions and the fovea. The flank test subtends 30 x 24° and can be placed anywhere in the visual field, using external fixation marks. The fovea test is used at a 2 m test distance where the test area subtends 8 x 6°. The examples shown come from the right nasal flank of a subject with vigabatrin-associated optic atrophy and from the fovea of a subject with compressive optic neuropathy on the left (visual acuity 1.0). Mean Hit Rates equalled 54 and 68 per cent, respectively.
RBP
documentation
is growing rapidly. It is clear that the test principle does work, and it does amuse patients, not the least children. There is no indication that RBP lags behind conventional perimetry. It tends to depict more widespread damage than does HRP. The crucial question whether it can reveal visual system damage at earlier stages than conventional perimetry is actually very difficult to answer because independent indicators of damage are hard to come by. Nevertheless, a few reports have attempted to address this question [
3,4,5].
Overall, it appears that RBP holds considerable promise for the evaluation of glaucoma and neuro-ophthalmological conditions. Similarly, the inbuilt Rarebit Fovea Test, RFT, appears useful in macular conditions, including age-related macula degeneration and diabetes.
The RBP software is available as free-ware. The current version is No. 4. It differs from No. 3 primarily with regard to numbers and shapes of test areas (24 rectangles vs 30 circles). Versions No. 1 and 2 were never released in the public domain. The manual is available for download (pdf format, 130 KB).
The advent of new display technologies has made it possible to deploy rarebit tests in new formats. These employ special hardware and software (not free-ware). Feel free to contact
me for further information:
• The production of 30" WQXGA (Wide Quad eXtended Graphics Array) LCD screens has made it possible to adapt the RBP software to run both field and fovea tests at a single viewing distance. Unfortunately, convenience comes at a price: these screens are quite expensive and so is the associated hardware. The primary field of use may be in screening settings, e g, in optometric practice.
First results using the VisuBit set-up were presented at the 2008 EVER meeting
[6].
• The MacuBit test uses 0.5' diameter test spots in a 4° field for efficient testing of macular vision. It uses yet another display technology, namely, Digital Light Projection (DLP). Unlike RBP and VisuBit, this test is easily portable and does not need a darkroom.
Like the RareBit Fovea Test, the MacuBit provides Hit Rate and quality control statistics, but unlike the RFT, the MacuBit does not produce maps.
Dispensing with maps makes it possible to dispense with a fixation mark (and fixation control!), making for a very easy test, also for subjects with impaired central vision. The MacuBit runs in passes of about 30 seconds duration. Each pass encompasses 25 pairs of ever-new probe locations plus control presentations. The envisaged fields of application are (i) sensitive screening for and (ii) meaningful staging of disorders like Age-Related Macular Degeneration. See
[7,8,9]
for first results. Patents have been granted.
All the rarebit tests described above depend on the presentation of pairs of rarebits. In some situations, larger numbers of rarebits may be more useful. This topic is covered in a separate
section.
 thresholds, namely, one for detection and one for resolution.
This is easily recognized in daily life, for example, on approaching a distant road sign. The presence of letters can be recognized at a much longer viewing distance than that required for resolving the letters. The application of so-called high-pass spatial frequency filtering brings the target's detection and resolution thresholds into coincidence (Howland, Ginsburg & Campbell 1978 [
1])
and makes for a very simple test task, also in peripheral vision. High-pass resolution targets are easily generated in computer graphics. The scene was now set for High-pass Resolution or "Ring" Perimetry, HRP, which was presented in 1987. Its theoretical underpinnings were recently confirmed in a clinico-pathological study (Sjöstrand & Popovic 2005 [
2]).
thresholds, namely, one for detection and one for resolution.
This is easily recognized in daily life, for example, on approaching a distant road sign. The presence of letters can be recognized at a much longer viewing distance than that required for resolving the letters. The application of so-called high-pass spatial frequency filtering brings the target's detection and resolution thresholds into coincidence (Howland, Ginsburg & Campbell 1978 [
1])
and makes for a very simple test task, also in peripheral vision. High-pass resolution targets are easily generated in computer graphics. The scene was now set for High-pass Resolution or "Ring" Perimetry, HRP, which was presented in 1987. Its theoretical underpinnings were recently confirmed in a clinico-pathological study (Sjöstrand & Popovic 2005 [
2]).
 The modus operandi of HRP is to find the smallest discernible test target in a given location in the visual field. This is a straightforward procedure, as shown in the
interactive demonstration.
But, what if a test target straddles a deep scotoma, so that only a part of the target is visible? Should the patient respond in this situation? Actually, the question may seem artificial, because patients very rarely indicate that they see only parts of test targets (presumably because of the operation of cerebral "filling-in" mechanisms). Nevertheless, the question is disturbing. This is because it points to a possible excess of information in the target. How much of a target can be taken away without raising the threshold level? A simple answer is "most". The figure to the right illustrates various levels of degradation of an HRP target. Degradation was done by erasing blocks of a fixed size in random locations. The figure begs the question at what level of degradation crucial features have been lost. A similar neural degradation should occur when a target is imaged on a defective neural matrix. Degradation may still be imperceptible because of cerebral filling-in. Note that the possibility of over-abundant stimulation is common to all conventional perimetric test targets.
The modus operandi of HRP is to find the smallest discernible test target in a given location in the visual field. This is a straightforward procedure, as shown in the
interactive demonstration.
But, what if a test target straddles a deep scotoma, so that only a part of the target is visible? Should the patient respond in this situation? Actually, the question may seem artificial, because patients very rarely indicate that they see only parts of test targets (presumably because of the operation of cerebral "filling-in" mechanisms). Nevertheless, the question is disturbing. This is because it points to a possible excess of information in the target. How much of a target can be taken away without raising the threshold level? A simple answer is "most". The figure to the right illustrates various levels of degradation of an HRP target. Degradation was done by erasing blocks of a fixed size in random locations. The figure begs the question at what level of degradation crucial features have been lost. A similar neural degradation should occur when a target is imaged on a defective neural matrix. Degradation may still be imperceptible because of cerebral filling-in. Note that the possibility of over-abundant stimulation is common to all conventional perimetric test targets.
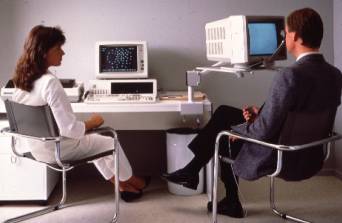 HRP or "ring" perimetry utilizes dual monitors driven by a personal computer (PC), arranged for maximum physical comfort for both the patient and the examiner. The ring perimeter was the first to dispense with an uncomfortable headrest, the first to include several feedback features, and the first to adapt to current reaction times. The latter features help to make the patient feel in command of the procedure. The use of an ordinary PC makes it possible not only to serve mundane PC tasks but also to address a host of non-perimetric diagnostic tasks, for example, testing optokinetic nystagmus and simulating migraine auras. Hence, HRP is part of a versatile diagnostic system, named the Ophthimus System. It was introduced in 1987 and was distributed by
Visumetrics/HighTech Vision.
HRP or "ring" perimetry utilizes dual monitors driven by a personal computer (PC), arranged for maximum physical comfort for both the patient and the examiner. The ring perimeter was the first to dispense with an uncomfortable headrest, the first to include several feedback features, and the first to adapt to current reaction times. The latter features help to make the patient feel in command of the procedure. The use of an ordinary PC makes it possible not only to serve mundane PC tasks but also to address a host of non-perimetric diagnostic tasks, for example, testing optokinetic nystagmus and simulating migraine auras. Hence, HRP is part of a versatile diagnostic system, named the Ophthimus System. It was introduced in 1987 and was distributed by
Visumetrics/HighTech Vision.
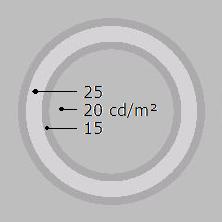 Each HRP test target consists of a bright circular core surrounded by dark borders. The dimensions and luminances are carefully calculated to make the target invisibly melt into the background if unresolved (try viewing the below figure from various distances to see the vanishing effect).
The short test distance, 0.16 m, causes powerful foreshortening of peripherally presented targets, and powerful parallax effects in the monitor's glass envelope. These effects are compensated in software, so the rings always appear as true rings of correct angular dimensions. 14 different sizes are used, stepped by 0.1 of a logarithmic unit (1 decibel, dB). The largest ring nearly fills a full quadrant. Limitations of monitor technology precludes measurement of thresholds inside 5° from fixation unless test distance is increased as is done in the
CentRing test.
Each HRP test target consists of a bright circular core surrounded by dark borders. The dimensions and luminances are carefully calculated to make the target invisibly melt into the background if unresolved (try viewing the below figure from various distances to see the vanishing effect).
The short test distance, 0.16 m, causes powerful foreshortening of peripherally presented targets, and powerful parallax effects in the monitor's glass envelope. These effects are compensated in software, so the rings always appear as true rings of correct angular dimensions. 14 different sizes are used, stepped by 0.1 of a logarithmic unit (1 decibel, dB). The largest ring nearly fills a full quadrant. Limitations of monitor technology precludes measurement of thresholds inside 5° from fixation unless test distance is increased as is done in the
CentRing test.
 One very practical advantage of using different-size targets is that the test can begin with a check for the presence of vision in extended areas, even full quadrants. If no response is obtained, that area will not be further tested. This has the perhaps paradoxical effect of returning shorter examination times for severely damaged visual fields. Normal examination time is about 5 minutes. Fixation is monitored by occasionally projecting a target in the blindspot and fixation is encouraged by occasionally flashing a "Look here" text message at the fixation spot. Audible complaints are sounded on errors.
; average normal = 100%") HRP tests 50 locations inside the 30° central visual field. The locations are distributed in a pattern reminescent of normal isopters. This is calculated to facilitate both visual recognition of common field defect patterns and statistical analysis of results. Results are plotted as threshold target sizes, showing precisely what the patient could see in each location. The unusual format of result presentation initially received some criticism from perimetrists preferring interpolated gray-scales but the native format is retained. Its intuitive nature is appreciated by the patients, not the least in situations were it is necessary for patients to understand any limitations, for example, with regard to driving licenses. Further, intuitive understanding of results is a powerful incitament to good co-operation in follow-up examinations. Michael Wall's Motion Detection Perimetry uses a similar map format.
HRP tests 50 locations inside the 30° central visual field. The locations are distributed in a pattern reminescent of normal isopters. This is calculated to facilitate both visual recognition of common field defect patterns and statistical analysis of results. Results are plotted as threshold target sizes, showing precisely what the patient could see in each location. The unusual format of result presentation initially received some criticism from perimetrists preferring interpolated gray-scales but the native format is retained. Its intuitive nature is appreciated by the patients, not the least in situations were it is necessary for patients to understand any limitations, for example, with regard to driving licenses. Further, intuitive understanding of results is a powerful incitament to good co-operation in follow-up examinations. Michael Wall's Motion Detection Perimetry uses a similar map format.
 The animation schematically illustrates these ideas. The hexagons represent a small set of retinal receptive fields, of which 10 per
cent (randomly selected) are damaged (black). A DLS test target (white circle) typically envelops numerous
receptive field positions and is expected to return a normal result with this small degree of damage. Rarebits (red dots) are
very much smaller. With multiple presentations in ever-new locations, 10 per cent of the rarebit presentations should involve a damaged receptive
field and so go unseen.
The animation schematically illustrates these ideas. The hexagons represent a small set of retinal receptive fields, of which 10 per
cent (randomly selected) are damaged (black). A DLS test target (white circle) typically envelops numerous
receptive field positions and is expected to return a normal result with this small degree of damage. Rarebits (red dots) are
very much smaller. With multiple presentations in ever-new locations, 10 per cent of the rarebit presentations should involve a damaged receptive
field and so go unseen.
 and a subject with multiple sclerosis, who never had overt optic neuropathy. The red ellipse represents the expected location of the blindspot. Center inset: decimal visual acuity")
 RBP is implemented in computer graphics, in a single-monitor set-up. The software runs under Microsoft Windows. The test requires a modern liquid crystal display (LCD) and 0.5 m test distance (1 m for the central-most field). Both the LCD technology and the long test distance are crucial to achieve the required stimulus parameters (dot size = one-half of normal minimum angles of resolution; white dots on a black background). A 15" LCD occupies no more than 30° of visual angle at 0.5 m distance but by moving the fixation mark under software control it is possible to access a 60x45° visual field area. Incidentally, fixation is not monitored. This is not because fixation is unimportant but fixation data is notoriously difficult to evaluate. Instead, fixation is encouraged by dynamically altering the fixation mark.
 In addition to the regular 30° central-field test, there are functions for testing flanking regions and the fovea. The flank test subtends 30 x 24° and can be placed anywhere in the visual field, using external fixation marks. The fovea test is used at a 2 m test distance where the test area subtends 8 x 6°. The examples shown come from the right nasal flank of a subject with vigabatrin-associated optic atrophy and from the fovea of a subject with compressive optic neuropathy on the left (visual acuity 1.0). Mean Hit Rates equalled 54 and 68 per cent, respectively.
 • The production of 30" WQXGA (Wide Quad eXtended Graphics Array) LCD screens has made it possible to adapt the RBP software to run both field and fovea tests at a single viewing distance. Unfortunately, convenience comes at a price: these screens are quite expensive and so is the associated hardware. The primary field of use may be in screening settings, e g, in optometric practice.
 • The MacuBit test uses 0.5' diameter test spots in a 4° field for efficient testing of macular vision. It uses yet another display technology, namely, Digital Light Projection (DLP). Unlike RBP and VisuBit, this test is easily portable and does not need a darkroom.