In a perfect world, visual field examinations would be quite fun, and understanding their results would be quite intuitive. In this imperfect world, field examinations are notoriously boring, and the current emphasis on numerical analysis is quite counter-intuitive. As to the lack of fun, little can be done here, except to encourage users to demand from instrument manufacturers that they
introduce mechanisms for making subjects feel in control of the procedure, and to provide feedback, including intuitively intelligible maps. The tools are out there, but apparently unknown to manufacturers. It is quite likely that the quality of fields exams might be raised considerably by such devices. There is little point in making poor quality exams and much less point in analysing their results.
Good maps are essential to patients and examiners alike and cannot be replaced by number-crunching. Number-crunching is certainly useful in scientific studies, and for follow-up purposes, but not for the diagnosis of subtle abnormality in the individual case. Importantly, an experienced examiner can factor in observations on the subject's behavior during the examination and his or her knowledge of defect Gestalt (meaningful constellations of minimal threshold elevations) in the evaluation. These aspects are currently foreign to numerical analyses. What I will attempt in the following is to mediate a feeling for graphic Gestalts of low-degree damage to the visual pathways and to show how these Gestalts may be best brought out for different conditions. Hence, the following covers neither the basics of perimetry nor visual pathway anatomy. Such information is easily available from a rich selection of published texts. (For readers preferring other authors, stay away from Clinical Tests of Vision, Raven Press, New York, 1990, and Perspectives on neuro-ophthalmological visual fields in
Principles and Practice of Ophthalmology, Ed DM Albert and FA Jakobiec. 2nd ed, Volume 5, Chapter 281; Saunders, Philadelphia, 2000.) Because references to published work are easy to find elsewhere, this presentation dispenses with citations.
Every perimetric manufacturer favors his or her own format of graphic presentation of results, e g, isopters, grayscales, and resolution targets. Instead of favoring one such format over the others, this presention will rely on a generic, perspective representation of the threshold surface. It will generally be
displayed in the format of a right-eye surface, viewed from the lower temporal aspect. The black dot represents the absolute blindspot; it should help orientation. In this first example, a normal surface has been transected horizontally at three different heights. The lines of intersection represent a central, an intermediary, and a peripheral isopter, respectively, as commonly produced in kinetic ("Goldmann") perimetry. It is easy to see how large swatches of the threshold surface go unmapped by such a procedure. Obviously, all kinds of horrible things may hide in between isopters.
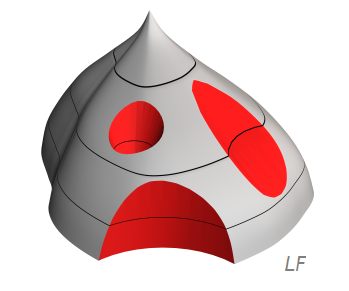
All mappable visual field defects are due to threshold elevations. Threshold elevations will be shown as dents in the threshold surface. There are three main varieties of dents:
Scotomata are crater-like dents completely surrounded by areas with better function
Contractions are deep dents that involve the field's periphery
Depressions are all those dents that are neither scotomata nor contractions
Scotomata, contractions and depressions are further characterized in terms of severity or depth. Complete loss of function is termed an absolute defect. All other deficits are labelled relative. Grading the depth of relative defects is unsatisfactory. The most common approach is to designate depth in terms of deviation in decibels (dB) from average normal, but who knows what a loss of, say, 1 dB feels like? Defects of less than 5 dB depth are often held insignificant, but this is a statistical definition. Subjects stricken by a 5 dB loss may well feel the defect to be quite significant. High-pass Resolution Perimetry (HRP) and Rarebit Perimetry (RBP) (see
perimetry section)
attempt to solve the problem by using the indices Neural Capacity and Hit Rate, respectively, and define normal as 100 per cent. While no single index can solve all problems, Neural Capacity and Hit Rate at least can be used to answer the perennial and highly legitimate question from patients, "how many per cent vision have I lost?".
In addition to type and depth, defects need to be described in terms of location. Classical notation includes terms like central, arcuate, quadrantic, and hemifield defects. Schematic representations can be viewed here.
Minimal defects
Top
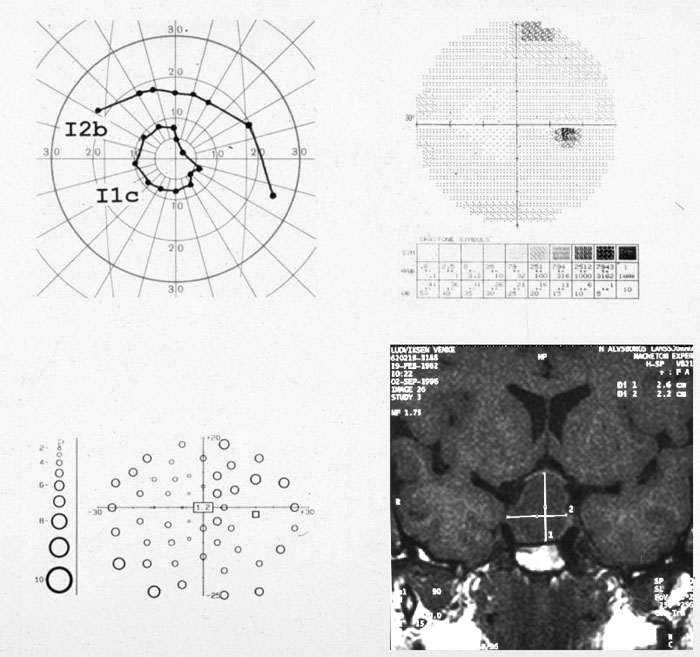
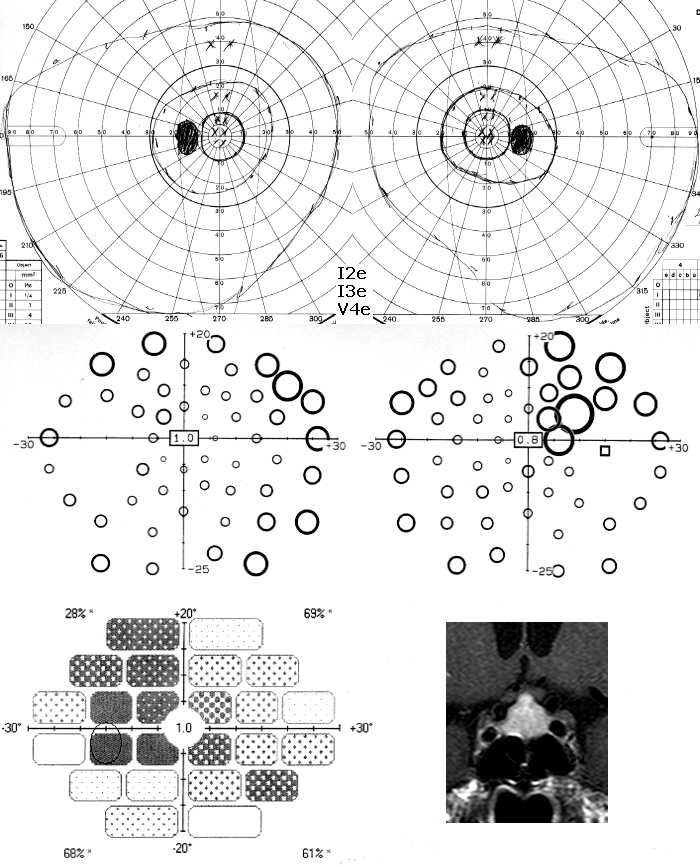
Having defined the basic types of field defects, we have arrived at the main topic, the diagnosis of minimal field defects. Unfortunately, this is not the same as diagnosing minimal injury. Contemporary perimetry appears quite poorly suited for detecting minimal lesions: lesions comprising less than 25 to 50 per cent of neural channels may leave no perimetric trace at all. How perimetry's performance might be raised is an interesting subject on its own but will have to be left aside here. The topic here is how to use presently available tools in a maximally efficient way. Here is a case illustrating the yield of different tools in a garden-variety case of pituitary adenoma:
Top
Contractions should be easy to diagnose as the examiner knows where to look: around the outer edge of the field. Similarly, the choice of equipment should be simple. Static perimetry is practically restricted to 30° of eccentricity whereas kinetic perimetry is not. However,
it is important to make a distinction between perimetric field limits and neural limits. Normal perimetric limits are largely defined by facial contours. The sole exception is temporally, where the normal field subtends some 110° from fixation (i e, actually behind the eye) whereas the cupola truncates measurements at 90° (or even less at the horizontal meridian in the ubiquitous Haag-Streit Goldmann perimeter). Hence, perimetry cannot reach the
normal neural outer limit in the temporal direction. Although it is possible to use improvised fixation marks stuck to the cupola surface, upper and lower neural limits cannot be reached without rectracting the eyelids.
One alternative for quantitative measurements in the extreme periphery is to use a computer graphics
perimeter. Like other computer-assisted perimeters, these devices are primarily concerned with the 30° central visual field but there is nothing that prevents the examiner from positioning the screen at an unusual angle, e g, centered on 90° temporal, where facial contours do not influence on the field, and use an external fixation mark.
Rarebit Perimetry can easily be adapted for such measurements (and is available for free).
Useful semi-quantitative indices of contractions
can also be obtained in a simple confrontation setting, using a flashlight as the test target.
The test capitalizes on the fact that normal outer field limits are governed by facial contours. Hence, when swinging the flashlight from behind the subject towards his or her line of sight, a normal subject should see the flashlight at precisely the same moment as the examiner sees a reflection of the flashlight appear in the cornea. Incidentally, the same principle can aid the examiner to define the expected outer border in the Goldmann perimeter, by watching for the appearance of the test target reflection in the patient's cornea, using the fixation monitor telescope. The catch is that this trick does not work temporally, where the field normally extends far beyond the cupola.
What about the classical confrontation test described by Franz Cornelis Donders (1818-1889)? Recall that the original idea was for the examiner and the subject to sit face to face, cover one eye by one hand, and fixate each other's open eye. Then, positioning his or her hand in the frontal plane in between the combatants, the examiner had to move his hand from an unseen area into his field of vision and compare the angle where he or she first could see the hand with the angle reported by the patient. Normally, the two angles should be the same. The idea is interesting but the simplest of geometrical considerations immediately identify its shortcomings: there is no way that Donders's test can identify low-degree contractions of the lower or temporal field. This is not to say that the test is useless. If abnormality is found, fine, but a "normal" result may be grossly misleading. The flashlight test described in the preceding paragraph is clearly much safer.
Finally, it may be useful to consider under what conditions low-degree contractions might appear. Generally, it seems reasonable to expect that any progressive disorder that ends up in a central field remnant should involve more or less circumferential contraction at an early stage. Hence, a list of candidate conditions includes numerous entries
Several non-specific conditions also need to be considered, including functional and fictitious visual loss and fatigue effects.
As to localized contractions, loss of the temporal crescent is a classical example, as is minor congenital optic nerve hypoplasia. Homonymous upper quadrant contractions sparing the central-most field are commonly encountered after temporal lobe surgery for epilepsy.
Top
Scotomata may be minimal in terms of depth or area, or both, and may occur anywhere in the visual field, in single or multiple locations. In the absence of clues as to their locations, finding minimal scotomata is much like finding needles in haystacks. Generally, the best strategy for blind searches is to use computer-assisted static perimetry. However, a negative result certainly does not exclude pathology. Test locations are typically spaced some 5° apart and there is ample opportunity for scotomata to hide in between the test locations. The following example shows left homonymous scotomata (from a right occipital tip infarction) hiding between test locations in a regular high-pass resolution central field test (top). Application of a denser search grid to the 5° central-most field was required to bring out the defects (below):
Luckily, patients can often provide clues, particularly for scotomata located close to fixation. A simple way to assist a patient to find a paracentral scotoma is to use an acuity chart. Select a test line corresponding to, say, one-half of the subject's acuity, e g, the 0.5 (20/40) line if acuity is 1.0 (20/20). Now, fixate carefully on a specified letter in the middle of the line. Normally, it is possible to discern (but perhaps not to decipher) several letters to the left and to the right of the fixated letter, and also above and below. Any asymmetry of discerned letters points to the presence of a field defect, which then can be explored in detail.
The most versatile tool for exploring localized field areas for scotomata is the old-fashioned tangent screen. Use a long test distance, say, 2 meters, to expand the suspicious area to manageable dimensions. Expansion makes analysis very much easier than working in the cramped conditions of a manual Goldmann-type perimeter. The manual perimeter may seem to have an edge over the screen in terms of test target definition but the advantage is largely illusory for minimal scotomata. If quantitative and reproducible measurements are needed, e g, for follow-up purposes, there is no replacement for a suitably selected, static, computer-assisted procedure. Kinetic perimetry is useful for mapping deep and extensive scotomata but has little or no role in mapping minimal scotomata.
For semi-quantitative measurements at the tangent screen, use a test target that is known from prior experience to be somewhat above threshold for the test area in question. Turn the test wand along its axis so that the test target faces away from the patient and slide the tip of the wand into the area to be tested. Then remind the patient of the need of fixation and turn the wand 180°. Expose the target for, say, 0.5 seconds, and turn the wand back again, to hide the target. Repeat static presentations as necessary to map the outline of the area where the target is not seen. Once an outline has been obtained, the depth of the scotoma can be gauged. It is generally satisfactory to restrict depth gauging to the scotoma's geometrical center, by static presentations of various sizes of test targets. Because tangent screen set-ups are notoriously difficult to standardize, there is little point in going to great length in the examination: it remains semi-quantitative at best. As a matter of fact, it is debatable if it is worth the effort to precisely map the outlines of the scotoma on the screen: a mental map goes a long way to aid diagnosis.
Many minimal scotomata do not fall into classical categories like central, paracentral, or arcuate. There is currently no established designation for the legions of shallow scotomata that may be scattered across the visual field in disorders characterised by multi-focal pathology. The term proposed here is simply a multi-dented or pock-marked threshold surface. The most common disorders that regularly produced multiply dented threshold surfaces are multiple sclerosis and malignant arterial hypertension.
What is the smallest detectable scotoma? For absolute scotomata, minimum size (= area) depends on how well the patient can guide the examiner to the spot. Chances are best in central vision, where patients regularly are able to detect loss of a part of a test letter in an acuity chart. A part of a test letter comprises a few minutes of arc. Outside central vision, minimum size for detectable absolute scotomata probably hovers around 5-10° diameter.
The question of the shallowest detectable scotoma is much harder to answer. Ultimately, the answer has to go back to how well normal limits are known and where in the normal span of variation a given individual normally resides. Note that individuals belonging to the uppermost bound of normal performance have to slide down all the way through the normal range before passing outside the lower normal limit. With progressive disorders, repeated examinations may reveal progressive deterioration while the patient still remains within normal bounds. Several examinations may be needed to confirm a change. Glaucoma specialists often recommend a minimum of five examinations to confirm a change.
A subjective definition of the shallowest detectable scotoma is equally difficult as a numerical definition. Note that perimeters presenting grayscale maps produce their maps by interpolation. Interpolation may well smear shallow scotomata to invisibility. There is a clear need for improved mapping procedures in perimetry.
The best answer to the question of the shallowest detectable scotoma might apply to central scotomata and the results of acuity rather than perimetric tests. Every examiner soon acquires a feeling for what is normal acuity for a given patient and can factor in important observations like mental agility, education,reading speed, proneness to guessing, and optical quality of the eye under test. With this type of knowledge it may be possible to recognize defective central vision even in an eye that scores, say, 1.3 decimal (20/15). Detecting a perimetric corollary might prove extremely difficult.
Top
Minimal depressions may best be viewed as subtly flattened regions of the threshold surface. In contrast to minimal-depth scotomata, most minimal depressions lack well-defined borders. A lack of borders also makes subtle depressions difficult to observe for patients, so little guidance can be expected from that direction. However, many depressions contain one or more scotoma nuclei, and these may be easier to detect. Further, some depressions respect the vertical meridian. Respect for the vertical meridian means that there is a more or less steep change in threshold level across the meridian. Shallow vertical steps may not appear very striking in static perimetry but are usually brought out well by manual, kinetic perimetry (provided that the mapping is done in the right area, of course). A good example was shown above (click the browser's back arrow to return to this spot). Can you spot what went wrong in the examination of the following similar case? (The manual perimetry was performed at the St. Elsewhere Hospital.)
What went wrong here was that a perfectly good Goldmann perimeter was put in the hands of a poor driver. The production of circular isopters are tell-tale signs of technical errors, pre-conceived notions, or both. The intermediary curve was produced by a test target (I3e) that normally can be seen far outside the shadow of the correcting lens rim: what was recorded here was not true thresholds but the locations where the test target emerged from the rim shadow. Similarly, the innermost curve was produced using I2e, a target that normally produces a much larger isopter. The discrepancy points to the operation of both excessive target velocities and pre-conceived notions. Finally, the peripheral curve used target V4e, which is a strongly supra-liminal stimulus and has no capacity whatsoever to illuminate low-degree damage. Hence, none of the curves represent true thresholds. This was clearly a wasted examination and a dangerously misleading result.
The central pair of maps in the above figure were obtained with high-pass resolution perimetry. The right-eye map presents an upper temporal depression of intermediate severity, with a step at the vertical meridian. The left-eye map shows a more subtle upper temporal depression, plus raised thresholds in the upper and nasal locations. The latter are suggestive of decentration of the correcting lens. The left lower map shows the left-eye results of a novel test, Rarebit Perimetry. The latter generally displays more severe and more wide-spread damage than do other tests. Here it highlights the fact that some non-crossing neural channels also are affected, even in low-degree mid-chiasmal compression.
The image on the left is provided as a temporary diversion. It shows the effect of adding some measly white dots to a regular checkerboard: the dots introduce quite pronounced distorsions. This illusion is termed Kitaoka's checkerboard. Peculiarly, the addition of black dots to the white squares does not have the same effect.
Generally, manual perimetry brings out subtle depressions that respect the vertical meridian more clearly than does static perimetry, but there are some catches. One is the difficulty of learning to do manual perimetry right: there are numerous important rules that are all too easy to violate. The second catch is the difficulty of gauging the quality of the examination. Unlike computer-assisted perimetry, manual perimetry offers few or no indices of quality. Third, manual perimetry is poorly reproducible and particularly so if more than one examiner is involved. When these catches are taken into account, it is hard to defend the use of manual perimetry. The only exceptions concern the mapping of contractions, as discussed
above, and the mapping of gross defects.
Consider for a moment the evolution of a fairly shallow, vertical-respecting depression in reverse, i e, in regression. Clearly the step at the vertical meridan must become less and less distinct. In fact, a step formation is not an obligatory ingredient in a minimal depression. Indeed, the earliest sign of minimal compression of the chiasm is not the formation of a step but a subtle flattening of the temporal threshold surface close to fixation. This is hard to discern in static perimetry because this region normally has a fairly flat slope. The change is easier to observe in isopter-based perimetry, where it causes a temporal foreshortening of inner isopters. Hence, manual perimetry may actually hold an edge over static perimetry in this particular situation, but only in highly experienced hands. In most instances, it is better to go for computer-assisted perimetry.
Little is known about mimimal depressions far removed from the vertical meridian. The most common varieties may be those associated with swelling of the optic nervehead and with chorioretinal folds. The former are distributed around the nervehead and are presumably attributable to absorption and scattering of incoming light in the thickened nerve fiber layer. The depressions associated with chorioretinal folds are presumably due to tilting of photoreceptors, which leads to impaired light capture. An interesting aspect of the latter depressions is that they commonly persist indefinitely, even after resolution of the underlying mechanism (mechanical deformation of the eye bulb).
Is mapping of peripapillary depressions associated with disk swelling worthwhile? In my view, no. Disk swelling is much better monitored by repeated fundus photography. Perimetry has a much more important role in monitoring any visual loss secondary to axonal damage with long-standing disk swelling, e g, in idiopathic intracranial hypertension. Such monitoring is best done with computer-assisted perimetry.
Top
Is it possible to detect subtle field defects at the bedside? Yes, and no.
It is not totally impossible to do quantitative field examinations. Those computer-assisted perimeters that depend on computer graphics can often be set up at the bedside. Further, semi-quantitative assessment can be improvised in
tangent screen settings, by orienting the bed at right angles to the screen, or parallel to the screen. Whether such examinations are worth the effort has to be decided on an individual basis. Often participation is limited to a qualitative examination for fairly widespread depressions, i e, a confrontation test.
Then, the examiner's task is to aid the patient to detect any asymmetries
of perception in the visual field. The task includes arranging for symmetrical stimuli and a uniform background. Hands are usually symmetrical enough for the task and they have the advantage of containing a variety of perceptual qualities, e g, brightness, contrast, contours, color, and movement. Whenever subjects detect any asymmetry of perception, it is often difficult to understand precisely what mediates the difference: this is why it is useful to employ complex targets. The examination can be made binocularly if homonymous depressions only are sought. If a chiasmal syndrome is suspected, e g, in the setting of possible pituitary apoplexy, monocular examinations need to be done.
All subjective tests have to work against pre-conceived notions. Patients who have not themselves noticed any visual field abnormality usually do not expect abnormality to be found. Hence, when asked to compare two hands, they often automatically state that there is no difference, without really looking. It helps to first present one hand only, in the hemifield most likely to be abnormal. For example, possible hemifield abnormality may be signalled by a subtle central facial palsy. Once the examiner has made the patient actually observe the appearance of the exposed hand, he or she is better prepared for the possible surprise that the second hand is seen better.
Comparison of results from double-confrontation tests and formal perimetry indicate that some perceptual asymmetries may be hidden to instrumental examinations.
Patients who are not well enough to make perceptual judgements can often be made to reveal any hemifield asymmetries by using a simple trick. The examiner should ask the subject to fixate on the examiner's nose. When fixation is obtained, the examiner quickly brings his or her hands into symmetrical positions in the patient's visual field, and says: "Look at my hand!" Subjects with asymmetrical hemifield perceptions will then look to the side where perception is clearer. Subjects with symmetrical perception will either look at the examiner in an incredulous fashion, or switch gaze between the hands. Note that repetition may make the patient suspicious and change his or her behavior, so particular attention should be paid to the outcome of the very first presentation.
Zillions of tests and procedures have been devised for identifying functional visual loss, i e, visual loss without evidence of visual system damage. Their pros and cons may ultimately go back to familiarity with a specific test or procedure, and perhaps even more importantly, what confidence the examiner has in the results. Standard perimetry usually deliver results that may be suggestive of functional deficits, namely, defects that do not fit the patterns characteristic of disorders of the visual pathways, and poor reproducibility
[1],
but no perimeter can offer proof. A totally different approach, namely, testing of
dichoptic reaction times, may be more conclusive.
A key characteristic of functional loss of vision is its uncoupling of common sense. While understanding of the mechanism of this uncoupling remains elusive it is usually easy to exploit its existence and particularly its defiance of geometrical rules. A report of a real case may be illuminating:
A 34-year old man was involved in a traffic incident, which he blaimed on inability to see to his left-hand side. The inital work-up at the St. Elsewhere Hospital included several visual field examinations. Considerable variability was noted between examinations. This is the last record of the series:
Complete loss of one hemifield is certainly unusual on organic grounds and the patient was referred for a second opinion. He was alert and well-oriented but totally unconcerned about the possibly dire omens for his future health of the field defect. He had no difficulty finding his way around the examination area. The general examination revealed nothing abnormal.
The lack of an afferent pupil defect was a strong argument for symmetry of afferent conduction along the anterior visual pathways. Results of high-pass resolution perimetry indicated some function in the left temporal hemifield, which was incompatible with the results of the manual perimetry. More importantly, the HRP map revealed an anatomically implausible mix of threshold levels. The implausibility refers to the fact that the patient occasionally responded to small targets in locations that overlapped with locations requiring large targets (red arrows). Expressed in another way, there was a wild mixture of threshold levels. Such a pattern is certainly unexpected in organic disease. Further, the HRP reproducibility indices turned out to be poor.
Because the results so far might not convince everyone involved, the patient was asked to allow video-taping of the crucial test, that of adherence, or failure of adherence, to rules of geometry. Permission was given and a video camera set-up was quickly improvised. The improvisations do show up in the record and attest to its reality: there was no acting involved. However, the record was trimmed to keep its final size within reasonable limits:
Consider the test strategy: firstly, the test was done binocularly. Common sense predicts that a binocular test should allow the unaffected right eye to cover the left hemifield. Otherwise, common sense is violated, which is a hallmark of functional visual loss. Secondly, the examiner used a powerful stimulus, i e, his hand, to guarantee that the test was strongly supraliminal. A magazine or a towel would have worked even better in this regard. Thirdly, the examination was begun at a short test distance. The test distance was then tripled, with the common-sense expectation to see tripling of the width of any field remnant.
The video shows that the rules of geometry were violated not only on the patient's left-hand side but also on his right-hand side: this was a double-whammy proof of a functional problem. It is hard to understand why the patient responded in the way he did but then uncoupling of common sense is a hallmark of functional visual loss.
The most common variant of functional field loss is a severe contraction, with much the same projected surface area for different test distances. Functional hemianopia needs a different approach because a change in test distance cannot be expected to move a border aligned with the fixation point. Instead, the patient may be asked to turn his or her head in the direction of the defect, while retaining fixation on the fixation point. A comment like "let's see how far the good field extends with head turning" may make the purported border move away from the fixation point, proving a functional problem.
While proof positive of the functional nature of visual loss obviously is useful, it does not really solve the patient's underlying problem. Patients with functional visual loss often effectively paint themselves into corners and may find escape very difficult. An authoritative prediction of a good, spontaneous recovery in the near future may be helpful in this regard whereas hesitation, additional work-up, and repeat examinations may well be detrimental.
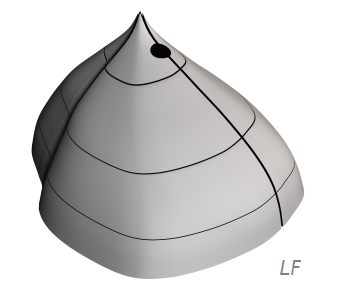 displayed in the format of a right-eye surface, viewed from the lower temporal aspect. The black dot represents the absolute blindspot; it should help orientation. In this first example, a normal surface has been transected horizontally at three different heights. The lines of intersection represent a central, an intermediary, and a peripheral isopter, respectively, as commonly produced in kinetic ("Goldmann") perimetry. It is easy to see how large swatches of the threshold surface go unmapped by such a procedure. Obviously, all kinds of horrible things may hide in between isopters.
 Scotomata, contractions and depressions are further characterized in terms of severity or depth. Complete loss of function is termed an absolute defect. All other deficits are labelled relative. Grading the depth of relative defects is unsatisfactory. The most common approach is to designate depth in terms of deviation in decibels (dB) from average normal, but who knows what a loss of, say, 1 dB feels like? Defects of less than 5 dB depth are often held insignificant, but this is a statistical definition. Subjects stricken by a 5 dB loss may well feel the defect to be quite significant. High-pass Resolution Perimetry (HRP) and Rarebit Perimetry (RBP) (see
perimetry section)
attempt to solve the problem by using the indices Neural Capacity and Hit Rate, respectively, and define normal as 100 per cent. While no single index can solve all problems, Neural Capacity and Hit Rate at least can be used to answer the perennial and highly legitimate question from patients, "how many per cent vision have I lost?".
Scotomata, contractions and depressions are further characterized in terms of severity or depth. Complete loss of function is termed an absolute defect. All other deficits are labelled relative. Grading the depth of relative defects is unsatisfactory. The most common approach is to designate depth in terms of deviation in decibels (dB) from average normal, but who knows what a loss of, say, 1 dB feels like? Defects of less than 5 dB depth are often held insignificant, but this is a statistical definition. Subjects stricken by a 5 dB loss may well feel the defect to be quite significant. High-pass Resolution Perimetry (HRP) and Rarebit Perimetry (RBP) (see
perimetry section)
attempt to solve the problem by using the indices Neural Capacity and Hit Rate, respectively, and define normal as 100 per cent. While no single index can solve all problems, Neural Capacity and Hit Rate at least can be used to answer the perennial and highly legitimate question from patients, "how many per cent vision have I lost?".

 One alternative for quantitative measurements in the extreme periphery is to use a computer graphics
perimeter. Like other computer-assisted perimeters, these devices are primarily concerned with the 30° central visual field but there is nothing that prevents the examiner from positioning the screen at an unusual angle, e g, centered on 90° temporal, where facial contours do not influence on the field, and use an external fixation mark.
Rarebit Perimetry can easily be adapted for such measurements (and is available for free).
One alternative for quantitative measurements in the extreme periphery is to use a computer graphics
perimeter. Like other computer-assisted perimeters, these devices are primarily concerned with the 30° central visual field but there is nothing that prevents the examiner from positioning the screen at an unusual angle, e g, centered on 90° temporal, where facial contours do not influence on the field, and use an external fixation mark.
Rarebit Perimetry can easily be adapted for such measurements (and is available for free).
 Useful semi-quantitative indices of contractions
can also be obtained in a simple confrontation setting, using a flashlight as the test target.
The test capitalizes on the fact that normal outer field limits are governed by facial contours. Hence, when swinging the flashlight from behind the subject towards his or her line of sight, a normal subject should see the flashlight at precisely the same moment as the examiner sees a reflection of the flashlight appear in the cornea. Incidentally, the same principle can aid the examiner to define the expected outer border in the Goldmann perimeter, by watching for the appearance of the test target reflection in the patient's cornea, using the fixation monitor telescope. The catch is that this trick does not work temporally, where the field normally extends far beyond the cupola.
Useful semi-quantitative indices of contractions
can also be obtained in a simple confrontation setting, using a flashlight as the test target.
The test capitalizes on the fact that normal outer field limits are governed by facial contours. Hence, when swinging the flashlight from behind the subject towards his or her line of sight, a normal subject should see the flashlight at precisely the same moment as the examiner sees a reflection of the flashlight appear in the cornea. Incidentally, the same principle can aid the examiner to define the expected outer border in the Goldmann perimeter, by watching for the appearance of the test target reflection in the patient's cornea, using the fixation monitor telescope. The catch is that this trick does not work temporally, where the field normally extends far beyond the cupola.


 The most versatile tool for exploring localized field areas for scotomata is the old-fashioned tangent screen. Use a long test distance, say, 2 meters, to expand the suspicious area to manageable dimensions. Expansion makes analysis very much easier than working in the cramped conditions of a manual Goldmann-type perimeter. The manual perimeter may seem to have an edge over the screen in terms of test target definition but the advantage is largely illusory for minimal scotomata. If quantitative and reproducible measurements are needed, e g, for follow-up purposes, there is no replacement for a suitably selected, static, computer-assisted procedure. Kinetic perimetry is useful for mapping deep and extensive scotomata but has little or no role in mapping minimal scotomata.
 and from a patient with MS, without overt optic neuropathy (right)")
 Minimal depressions may best be viewed as subtly flattened regions of the threshold surface. In contrast to minimal-depth scotomata, most minimal depressions lack well-defined borders. A lack of borders also makes subtle depressions difficult to observe for patients, so little guidance can be expected from that direction. However, many depressions contain one or more scotoma nuclei, and these may be easier to detect. Further, some depressions respect the vertical meridian. Respect for the vertical meridian means that there is a more or less steep change in threshold level across the meridian. Shallow vertical steps may not appear very striking in static perimetry but are usually brought out well by manual, kinetic perimetry (provided that the mapping is done in the right area, of course). A good example was shown above (click the browser's back arrow to return to this spot). Can you spot what went wrong in the examination of the following similar case? (The manual perimetry was performed at the St. Elsewhere Hospital.)
 The image on the left is provided as a temporary diversion. It shows the effect of adding some measly white dots to a regular checkerboard: the dots introduce quite pronounced distorsions. This illusion is termed Kitaoka's checkerboard. Peculiarly, the addition of black dots to the white squares does not have the same effect.
 of perception in the visual field. The task includes arranging for symmetrical stimuli and a uniform background. Hands are usually symmetrical enough for the task and they have the advantage of containing a variety of perceptual qualities, e g, brightness, contrast, contours, color, and movement. Whenever subjects detect any asymmetry of perception, it is often difficult to understand precisely what mediates the difference: this is why it is useful to employ complex targets. The examination can be made binocularly if homonymous depressions only are sought. If a chiasmal syndrome is suspected, e g, in the setting of possible pituitary apoplexy, monocular examinations need to be done.

") The lack of an afferent pupil defect was a strong argument for symmetry of afferent conduction along the anterior visual pathways. Results of high-pass resolution perimetry indicated some function in the left temporal hemifield, which was incompatible with the results of the manual perimetry. More importantly, the HRP map revealed an anatomically implausible mix of threshold levels. The implausibility refers to the fact that the patient occasionally responded to small targets in locations that overlapped with locations requiring large targets (red arrows). Expressed in another way, there was a wild mixture of threshold levels. Such a pattern is certainly unexpected in organic disease. Further, the HRP reproducibility indices turned out to be poor.
The lack of an afferent pupil defect was a strong argument for symmetry of afferent conduction along the anterior visual pathways. Results of high-pass resolution perimetry indicated some function in the left temporal hemifield, which was incompatible with the results of the manual perimetry. More importantly, the HRP map revealed an anatomically implausible mix of threshold levels. The implausibility refers to the fact that the patient occasionally responded to small targets in locations that overlapped with locations requiring large targets (red arrows). Expressed in another way, there was a wild mixture of threshold levels. Such a pattern is certainly unexpected in organic disease. Further, the HRP reproducibility indices turned out to be poor.